
Bitcoin could face further downside before staging its next major rally, according to new analysis from on-chain data firm CryptoQuant.
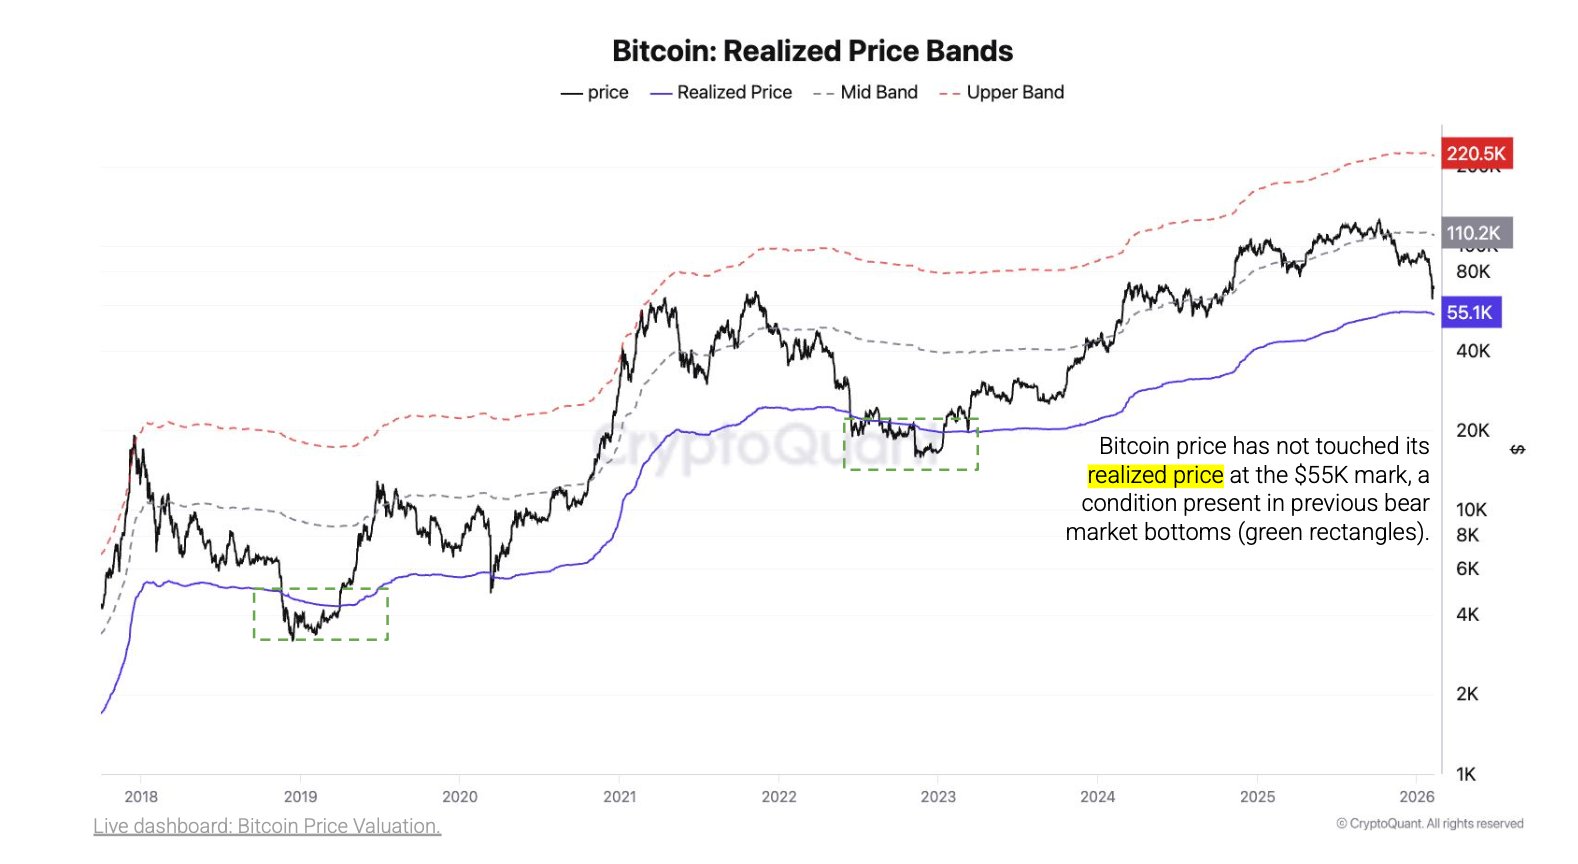
The firm noted that BTC has not yet revisited its realized price at the $55,000 level, a condition that has historically marked previous bear market bottoms.
At the time of writing, Bitcoin is trading around $68,554 and down by over 2.5% in the last seven days at the time of writing. A move down to $55,000 would represent a decline of roughly 19.7% from current levels.
What is Bitcoin Realized Price?
The realized price shows the average price at which all circulating Bitcoin last moved on-chain. Unlike the spot price, which shows where BTC is currently trading, the realized price measures the aggregate cost basis of holders.
When Bitcoin trades near or below this level, it typically signals that a large portion of the market is holding at a loss. Historically, those periods have coincided with late-stage bear market conditions and long-term accumulation zones.
CryptoQuant’s realized price band chart highlights three key levels: the realized price itself, a mid band, and an upper band. In past cycles, Bitcoin has touched the realized price before beginning a sustained recovery toward the higher bands.
A similar pattern unfolded in 2019, when BTC touched its realized price at around $3,000 and then rallied to the $15,000 levels in the same year. In 2023, the BTC price also dropped to its realized price near $20,000. This level ultimately acted as a macro bottom. In the following two years, BTC rallied sharply, eventually reaching an all-time high above $126,000 in 2025 before retracing.
Read also: Standard Chartered Sees Ethereum Outperforming Bitcoin in 2026, Projects ETH to Hit $7,500
Bitcoin Price Prediction: Downside Risk and Upside Potential
$55K marks Bitcoin’s realized price, historically tied to bear market bottoms, CryptoQuant wrote, stating that “past cycles saw BTC trade 24–30% below this level before stabilizing.”
If Bitcoin were to repeat that historical behaviour, a pullback toward $55,000 could serve as a structural reset before the next upward leg. Should $55,000 hold as support, CryptoQuant’s analysis suggests significant upside potential.
The mid band currently sits around $110,000, representing a potential gain of approximately 100% from the realized price level. The upper band stands near $220,000, which would imply a possible 300% advance if reached.
While such projections depend on broader market conditions, the data suggests that revisiting realized price has historically created a foundation for major rallies. As earlier reported, other analysts echo this sentiment, submitting that Bitcoin risks a deeper correction to $50,000 as retail sells and futures deleveraging accelerates.
It is important to note that past performance does not guarantee similar outcomes. Macroeconomic conditions, liquidity cycles, and institutional participation are different today compared to prior bear markets. Notably, top institutions like Strategy have continued to increase their Bitcoin bets.
Read also: Binance Converts $1B SAFU Reserve into Bitcoin
However, realized price remains one of the most closely watched on-chain indicators among long-term investors. It provides insight into the market-wide cost basis and can signal when sentiment and positioning have reached extreme levels.
At the time of writing, Bitcoin remains comfortably above the $55,000 threshold. Whether BTC revisits that level before attempting another breakout will likely depend on broader market momentum, capital flows, and macro developments in the months ahead. If the realized price pattern holds again, the next major move could begin only after that key level is tested.