
Ether (ETH), the second-largest cryptocurrency by market cap, is showing fresh bullish signs. After weeks of sluggish price action, ETH is now approaching a critical resistance level near $1,850, and traders are starting to take notice.
Several technical and on-chain indicators are flashing bullish, suggesting a breakout rally may be brewing.
ETH price outlook
On the daily chart, ETH has broken out of a falling channel pattern, a positive sign for momentum traders. This development represents the first major reversal of a long-standing downtrend.
Although ETH is still trading below the psychological $2,000 level, the breach of resistance could open the door for more upside in the near term. Meanwhile, bitcoin (BTC)’s rise above $97,000 has captured renewed interest from investors and market participants.
Interestingly, ETH is quietly building strength of its own in recent days. The latest price rebound shows a short-term recovery trend, and a successful retest could be the final step before a full-blown breakout.

Read also: XRP Breaks 5-Month Record in Monthly Returns, Outpacing Ethereum
ETH next targets: $2,000 and beyond
Using Fibonacci retracement levels, analysts pinpoint $2,000 as the next major resistance for the crypto asset, which is in line with the 23.6% level. If ETH clears this price mark, the next big hurdle will be the 200-day Exponential Moving Average (EMA) around $2,400, which also aligns with the 38.2% retracement level.
On the downside, support remains firm around the $1,600 area, keeping the bullish structure intact. According to CryptoQuant, derivative market sentiment is also improving. Net taker volume, a key metric of buyer vs. seller strength, turned positive on April 23 and 24 per the update.
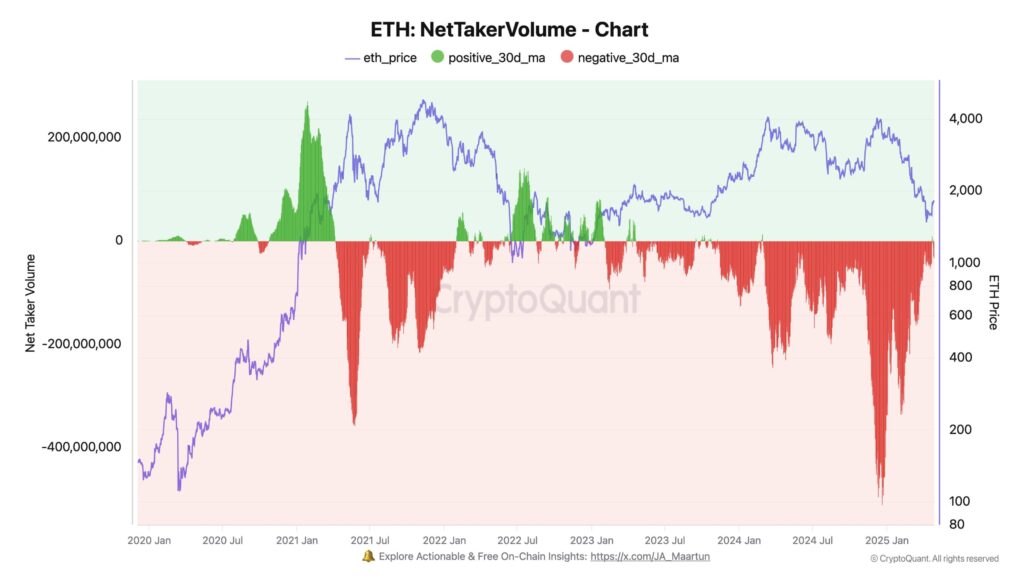
This suggests that buyer aggression is returning after weeks of ETH underperforming. As of May 1, the 30-day moving average hit $311,406, a solid jump indicating strengthening market confidence.
Read also: VanEck analyzes investment case for Ethereum, sets ETH 2030 price targets
Positive open interest and funding rate
Data further shows that ether’s Open interest has jumped by more than 3%, now standing at $21.60 billion. At the same time, the funding rate remains near 0%, significantly lowering the cost of holding long positions.
By implication, this funding rate encourages long traders to stay in the market longer, boosting confidence across the board.
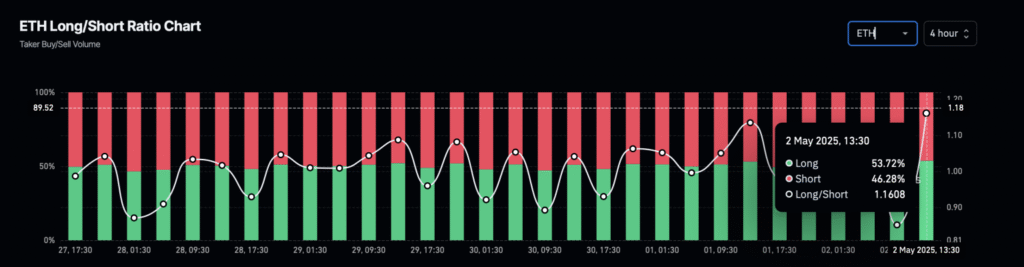
Additionally, the ETH long-to-short ratio also highlights bullish market behaviour. Over the past hours, 53.72% of positions have been long, pushing the long-to-short ratio to 1.1608. This indicates that traders are betting more on a positive ETH price outlook than declines, which is also a clear sign of bullish dominance.
Altogether, all signs point to ETH possibly forming a solid bottom. With open interest climbing, long positions increasing, whale accumulation rising and selling pressure easing, the setup for an ETH price breakout is looking solid.
If momentum holds, ETH could push past $2,000 and start a broader trend reversal in the coming weeks. Trading at $1,835 at the time of writing, ETH’s price gained just nearly 3% in the past month. However, top asset manager VanEck has projected the timeline for ETH and BTC to hit bull market peaks.