
Ether (ETH) is once again at a decisive moment as the second-largest cryptocurrency has managed to reclaim upward momentum this week. However mixed futures flows and range-bound trading suggest uncertainty is far from over.
With ETH hovering near critical technical levels, traders are watching closely to see whether the asset is preparing for a breakout or losing steam.
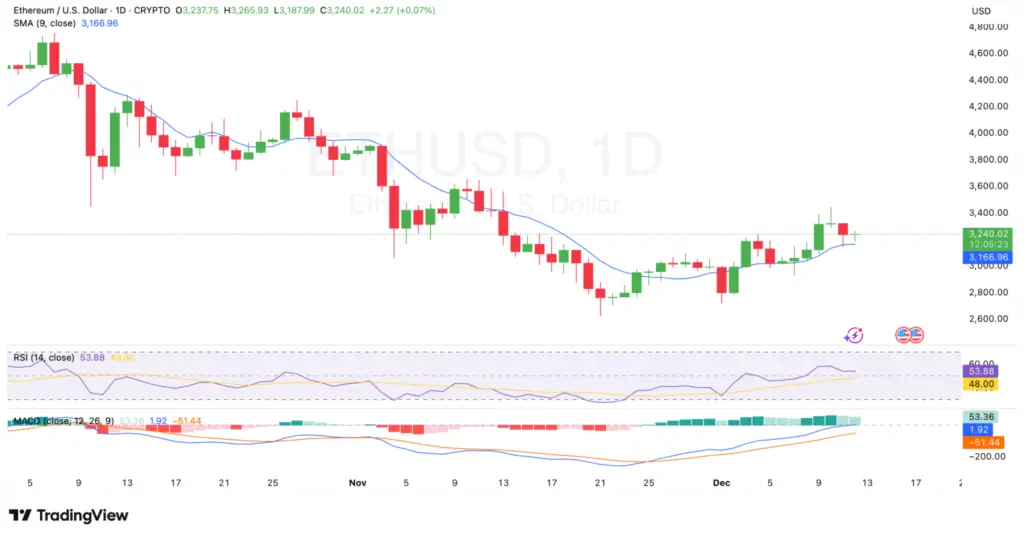
ETH has climbed 1.2% in the last 24 hours, pushing its price to $3,235.25. During this period, ETH moved between $3,160.13 and $3,267.70, reflecting a tight range as buying pressure and selling pressure continue to battle for dominance.
Its weekly chart shows a 3.5% gain, and the 14-day outlook adds a 5.7% increase, but the 30-day performance still sits at –7.0%, revealing the broader cooling phase ETH has been in throughout the month.
Despite the mild rebound, the market is showing early signs of exhaustion. Bulls have stepped in, but they haven’t yet shown the strength needed to confirm a sustained trend reversal. Without stronger momentum, ETH could easily slip back into the range it has been stuck in.
Ethereum Holds Above Key Simple Moving Average
Technical indicators reveal how delicate Ethereum’s current position is. The price is trading just above the 9-day Simple Moving Average (SMA), which sits at $3,166.96. This level is now acting as short-term support, and ETH’s ability to remain above it will heavily influence the next move.
The Relative Strength Index (RSI) at 53.88 sits just above the neutral 50 line. This suggests market equilibrium neither overheating nor showing signs of oversold pressure.
This is a classic consolidation signal, often seen before a decisive move in either direction. If RSI begins pushing higher, the Ethereum price could be gearing up for a bullish extension.
The Moving Average Convergence Divergence (MACD) reinforces this possibility. With a positive value of 53.36 and the MACD line sitting above the signal line at press time, the indicator shows early signs of bullish momentum returning. The positive histogram bars signal gradual growth in buying interest.
A clean breakout above the immediate resistance zone, particularly the $3,600 level, would confirm the bullish continuation that traders have been waiting for. However, a drop below the 9-day SMA would invalidate the near-term recovery and expose lower supports.
Futures Flows Reveal Volatility Beneath the Surface
While spot indicators continue to show resilience, futures flows paint a far more volatile picture.
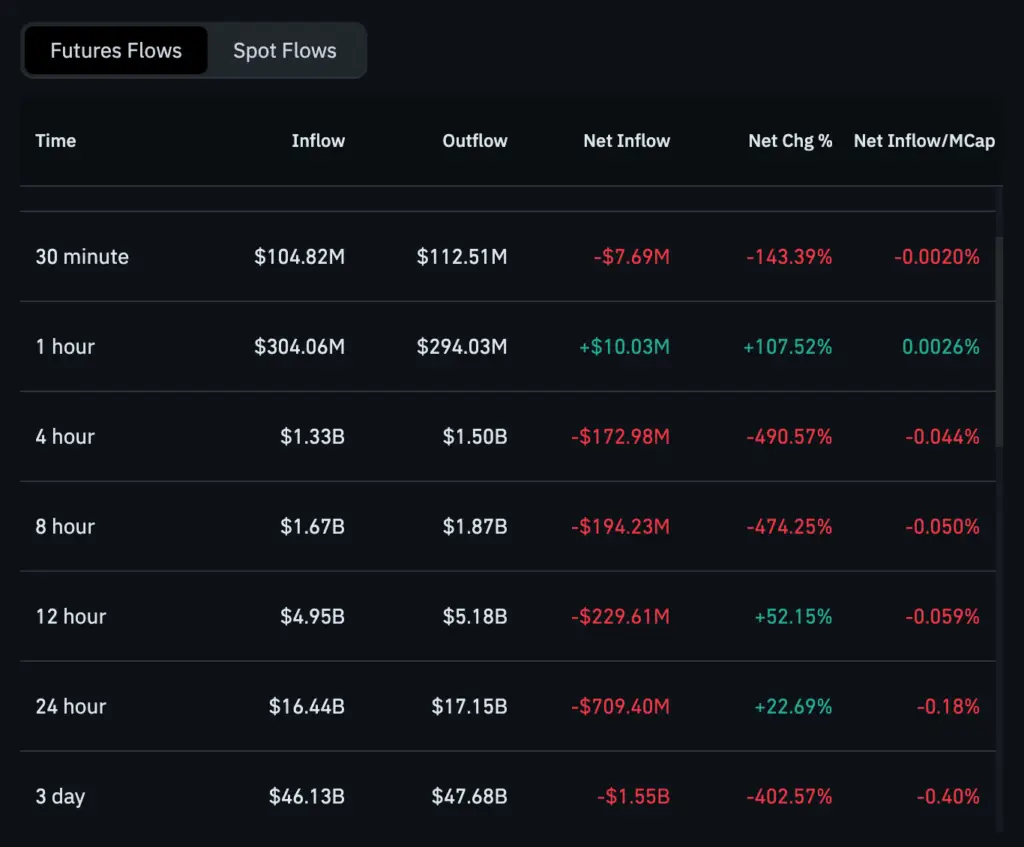
Over the last 30 minutes, Ethereum recorded a net outflow of $7.69 million, reflecting short-term risk-off sentiment. However, the one-hour data turns bullish, with a net inflow of $10.03 million, suggesting renewed interest from traders attempting to buy the dip.
Looking at longer time frames, the picture becomes more complex. The four-hour window shows a net outflow of $172.98 million, followed by an even larger $194.23 million outflow over eight hours. The twelve-hour period offers a brief sign of recovery, posting a modest inflow of $5.18 million.
This optimism fades on the daily chart, where Ethereum saw a heavy outflow of $709.40 million. Over the last three days, the trend intensified further, with a significant net outflow of $1.55 billion.
Overall, derivatives data reflects mixed sentiment. Traders appear willing to engage in short-term opportunities, but broader market conviction remains weak.
Ethereum Price Prediction: What Comes Next?
ETH’s next move depends on one critical factor, which is maintaining price action above the short-term SMA while building stronger momentum. If the bulls succeed, ETH could retest the $3,600 resistance and eventually aim for $4,000, especially if Bitcoin continues its recovery.
However, if ETH loses its SMA support and RSI drifts back below 50, the market could see a return to the previous range between $3,000 and $3,150. The coming days will determine whether ETH is gearing up for a sustained breakout or preparing for another leg of consolidation.