Shiba Inu (SHIB) is showing signs of resilience at a critical technical level, but growing weakness across momentum indicators is starting to raise fresh concerns about its short-term outlook.
At the time of reporting, SHIB is trading at $0.00000847, marking a 4.0% decline over the past 24 hours. Despite the drop, buyers continue to defend the 20-day simple moving average (SMA), keeping price action from slipping into a deeper correction.
During the past day, SHIB traded between $0.00000847 and $0.00000887, with selling pressure capping upside attempts. The meme coin’s market cap stands at $4.99 billion, supported by a circulating supply of 589.24 trillion SHIB tokens.
Trading volume remains healthy at $124.67 million, suggesting traders are still active even as momentum weakens. Looking at performance trends, Shiba Inu remains under short-term pressure. The token is down 4% over 24 hours and 3.0% over the past seven days, extending a phase of softness.
However, the picture improves slightly on a mid-term basis. SHIB is still up 7.5% over the last 14 days, though gains begin to fade when zooming out further, with the 30-day increase holding at 6.2%.
Technical Structure Shows Fading Momentum
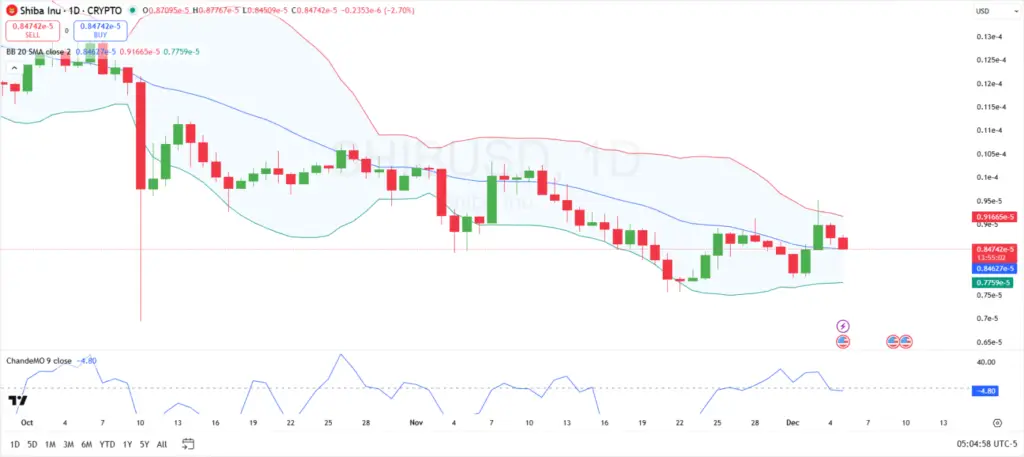
SHIB’s daily chart shows price drifting back toward the middle of the Bollinger Bands after failing to sustain movement above the mid-band. The 20-day SMA at $0.0000085 continues to act as immediate support, indicating buyers remain active around this level.
However, a subtle shift is taking place.The upper Bollinger Band has started to slope downward, signaling weakening upside momentum. While sellers are not aggressive, the lack of bullish follow-through suggests hesitation.
Immediate resistance now sits near $0.00000917, while downside support is visible around $0.00000775, a level that previously sparked a rebound after a brief lower-band breach.
Momentum indicators further echo diminishing buying pressure. The Chande Momentum Oscillator (CMO) currently reads –4.80, reflecting fading bullish strength and confirming that the previous breakout attempt failed to gain traction. The oscillator’s inability to return to positive territory shows limited buying conviction.
SHIB Futures Flows Paint a Mixed Picture
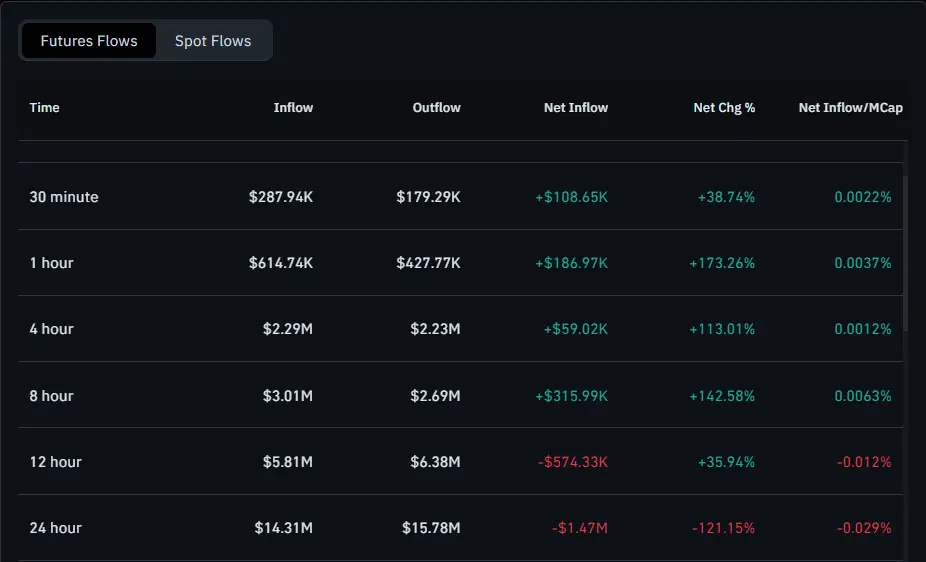
Futures market activity remains divided. On the 4-hour timeframe, inflows and outflows appear nearly balanced, with $2.29 million flowing in against $2.23 million flowing out, resulting in a modest $59,020 net inflow.
While this shows a positive 113.01% net change, the net inflow-to-market-cap ratio of just 0.0012% suggests the impact on overall structure is minimal.The 24-hour view, however, tells a different story.
Notably, traders recorded $14.31 million in inflows, but outflows climbed higher at $15.78 million, producing a –121.15% net change. This imbalance points to increasing selling pressure, with traders trimming exposure rather than committing to new long positions.
In the meantime, Shiba Inu’s ability to hold the 20-day SMA keeps bullish hopes alive. However, weakening momentum and inconsistent futures market flows suggest the memecoin faces a critical test in the days ahead.